Fundamental? Technical? What Just Happened to the Stock Market?

Between January 26 and February 9, the Dow lost more than 2,400 points, a 9 percent decline. This rapid fall in a short period of time has taken many of us back down memory lane to the financial crisis of 2008. Are we headed to a new crisis? A recession ?
When the stock market starts spiraling downward for more than a couple of days, we understand there is something more to the story than a mere “flash crash” or correction. What is actually going on behind the scenes, however, is not easy to uncover.
Financial markets are complex. They are affected by many forces: macro events, politics, fundamental information and news, technical movements of the market, market structure and instruments, spill-over effect from global markets, and so on. How can one decipher the main causes of a decline amid the noise? Could all factors be equally responsible?
This most recent fall began with news on inflation and future interest rate hikes. This is good news. Inflation has been one of the Fed’s carefully watched benchmarks for economic recovery since the financial crisis. If the Fed is on the trajectory to increase interest rates, then the Fed is confident that the economy is strong enough to sustain the increase.
This news was followed by more economic news which supported the Fed’s outlook: Jobless claims were down, productivity was up, unemployment was low, and wages were increasing.
But haven’t we been expecting that inflation would rise, and so would interest rates? Why the surprise?
As much as we have expected these things to happen sooner or later, no one was sure about the exact timing. It’s not the news about inflation and rate hikes that spooked the market. The implications of these indicators for the economy are what caused uncertainty among traders.
One of inflation’s implications is that the “real” value of an asset, such as a company, is less (as the purchasing power decreases), which may be interpreted as investors looking for a higher “real” rate of return.
Interest rate hikes may have an effect on the value of companies with high levels of debt on their balance sheets (e.g., Netflix). Such companies would need to pay higher interest on their debts, which would increase their interest costs, resulting in lower profits.
The macro indicators of inflation and interest rates do have tangible implications for the economy, which we should keep in mind and examine carefully – in general and on a case-by-case basis per company – as events unfold in the coming months.
But that’s not the end of the story.
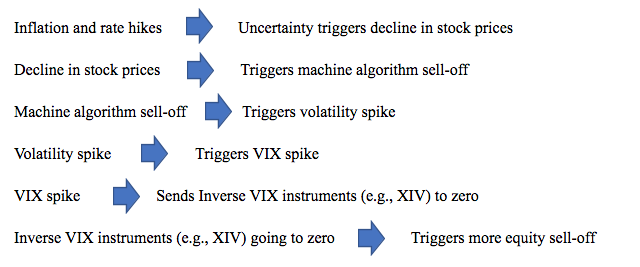
Unfortunately, the uncertainty among traders triggered machine algorithms that amplified the spiral downward. The majority of trades today are done by algorithms. Since these algorithms are triggered by certain signals, even a small decline could set the market to a sell-off.
The domino effect did not stop there. Market sell-offs tend to increase market volatility. another indicator of market uncertainty. This in turn caused the volatility index (i.e., VIX) to spike more than 200 percent. This is a “normal” reaction. When markets are down, volatility goes up. Therefore, the VIX spiking was not a surprise. The reactions of the instruments based on the VIX, however, were surprising.
It seems Wall Street is not lacking in creativity when it comes to constructing trading vehicles that have the potential to blow up when things go haywire.
What is the problem with these instruments? Let’s take for example VelocityShares Daily Inverse VIX Short-Term ETN (XIV). Market volatility has been dormant for many years. Since the financial crisis, we have not experienced any major volatility spikes except for the summer of 2015 or early 2016, which subsided quite quickly. Wall Street professionals managed to find ways to make “extra” money out of this low VIX situation by betting against it, and the XIV is one example of that. “Inverse VIX: means that when the VIX is low (i.e., volatility is low), the instrument is going up (i.e., “making money”). Hence, as long as volatility was dormant, whoever held this instrument made money.
One volatility spike, however, and these instruments can go almost to zero. That’s exactly what has happened to XIV – it has declined by more than 96 percent in a couple of days.
Money managers who have invested in these instruments had to sell other assets (i.e., stocks) in order to cover for these losses, which created another domino effect. How much are money managers invested in these VIX instruments? We don’t know. So, the sell-off could continue for a bit longer. (This type of instrument would be on our watch list as a barometer for understanding the full extent of the sell-off.)
Let’s recap the trail of events:

The macro indicators will take several months to a year to unfold. The technical indicators, however, are usually short-lived, and hopefully will subside soon.
Dr. Merav Ozair has more than 12 years of business and consulting experience and more than 15 years of teaching experience with both graduate students and financial professionals. Contact her at mr649@nyu.edu or @HoliSym.

