How to Calculate the Quality of a New Hire in 3 Easy Steps

Every company strives to make informed tactical decisions based on the data available at any given moment. Once a strategic afterthought, HR departments are increasingly turning to their own data and analytics to prove their ROI and earn their seats at the corporate strategy table.
While most HR departments track KPIs aligned with their recruitment pipelines, few know how to calculate the true value of a new hire. SHRM reports that only 33 percent of HR professionals feel that their current methodologies to measure quality of hire (QoH) are accurate. Given that each company has its own goals and relevant measurement criteria, creating a standard way to calculate QoH has proven to be a massive challenge.
However, it’s a challenge worth overcoming. According to the US Department of Labor, the average cost of a bad hire equals 30 percent of that individual’s annual earnings. These costs can have a serious impact on the bottom line, especially when bad hires are made in the well-paying echelons of upper management.
Measuring QoH may be a daunting obstacle, but it’s not impossible. Here’s how to do so in three easy steps:
Step 1: Identify the Right Metrics
HR professionals have a challenging role. It’s their job to know the inner workings of each department in the company. In order to place the right candidate in the right role, an HR pro needs to understand exactly what the open role entails — e.g., what the day-to-day will look like, what tools the new hire needs to use proficiently, etc. On top of this, an HR pro needs to understand the dynamic of the current team to ensure a candidate is the proper fit with respect to both personality and work style.
The quality of any hire amounts to a collection of data points, and it’s up to each individual company to decide which data points are indicative of a successful hire.
That said, Eric Knudsen, manager of people analytics at HR software provider Namely, recommends organizations use no more than four or five data points in their QoH calculations. Otherwise, the process can become needlessly complicated.
To zero in on your company’s relevant QoH metrics, start by making a list of all the employee and recruiting data already being tracked. Some possible metrics include:
– Initial performance: What does a high-performing new hire look like? How is new hire performance measured currently?
– Time to productivity: How quickly was the new hire able to onboard and ramp up?
– Culture fit: Does the new hire fit the culture? If so, how is this fit measured?
– Revenue produced: Is the new hire in a revenue-driving role? Can the amount of revenue they produce be tracked?
– Value alignment: How well do the new hire’s values align with the company’s?
– Tenure: How long has the new hire been with the company, and how have their scores on relevant metrics changed (or not) over time?
Step 2: Collect Data and Calculate Scores
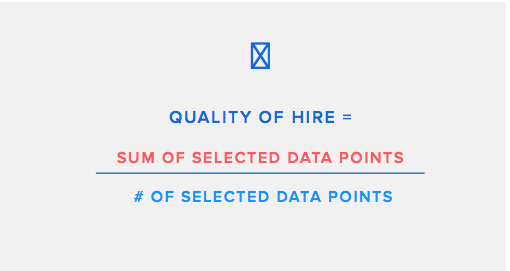
Once the right data points have been identified, it’s time to start tracking employees. Employee performance in a given metric can be measured by percentage or on a scale of 1-5. Employees’ scores in relevant metrics will be used to calculate QoH according to a simple formula:

(Image source: How to Measure Quality of Hire by JazzHR and Namely)
Here’s an example of how the formula could be applied in real life, using a rating scale of 1-5:
Employee Scorecard:
– Initial work performance: 4/5
– Ramp-up time: 4/5
– Culture fit: 5/5
– Overall productivity: 4/5– Total: 17
– 17 (sum of selected data points) / 4 (selected data points) = 4.25 (out of 5)
If we were to use a percentage-based scoring system, the formula would be the same:
Employee Scorecard:
– Initial work performance: 80 percent
– Ramp-up time: 80 percent
– Culture fit: 95 percent
– Overall productivity: 85 percent– Total: .8 + .8 + .95 + .85 = 3.4
– 3.4 (sum of selected data points) / 4 (selected data points) = 85 percent
Step 3: Optimize Your Process
Measuring QoH doesn’t end after the initial evaluation. Consider putting a regular measurement cadence in place. Getting managers to score employees based on these data points every six months will ensure you have ample data to measure QoH over the length of each employee’s tenure. As the organization and its departments grow over time, it’s important to update data points and collection methods to align with new goals that may arise.
QoH metrics should be customized according to the needs and goals of particular departments and organizations. For best results, work directly with each department’s management team to score individual employees. From here, QoH per department can be averaged to find an overall score for the company. This will help benchmark current recruiting strategies and help plan for future talent acquisition initiatives.
Allie Kelly is vice president of marketing at JazzHR.

