Where Work is Sparse and Getting Sparser
“Well, it’s a great time to stay in school,” said a brave mother to her child. She tried to put a positive spin on the job market her college graduate child is about enter into.
As unemployment continues to impact every community in the United States, many people are trying to avoid the job market by various creative or risky measures. These people’s choices are not necessarily reflected in unemployment figures.
For reasons such as these, the recent information on employment from the Bureau of Labor Statistics is particularly illuminating. The data from BLS shows how few or how many people are really employed. BLS compares these figures between states, suggesting what regions might be suffering particularly greatly from a lack of funds within a family or within a community.
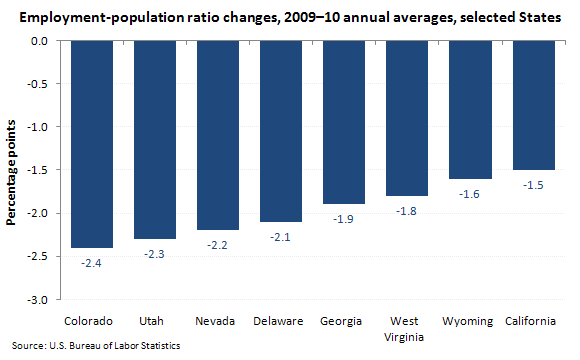
Nine states registered the lowest employment-population ratios in their series in 2010: California, 56.3 percent; Colorado, 62.8 percent; Delaware, 56.2 percent; Georgia, 57.0 percent; Hawaii, 59.4 percent; Kentucky, 55.6 percent; Nevada, 57.0 percent; North Carolina, 56.1 percent; and South Carolina, 54.5 percent. West Virginia again reported the lowest employment-population ratio among the states, 48.8 percent, which it has done for 35 consecutive years. With less than half of the state’s citizens employed, what resources are available to the other half?
In 2010, 32 states and the District of Columbia registered statistically significant deterioration in their employment-population ratios—the proportion of the civilian noninstitutional population 16 years of age and over with a job.
In your state, what are people doing who are not working? What evidence do you see of the deterioration of the employment-population ratios? It’s also always good to ask, who or what is benefiting from this surplus of non-working adults?


